I've been tasked by a decent sized developer, because of my extensive knowledge of economics and gaming, to help map the flow of an in-game economy. I'm curious if anyone has any suggestions having worked on this from the game side, of how to do this. Best examples of tools or process?
This is an old flow chart of Ultima online if I remember correctly....Is this how you might approach this. Is there a better way?
Any help would be appreciated.
🎉 Celebrating 25 Years of GameDev.net! 🎉
Not many can claim 25 years on the Internet! Join us in celebrating this milestone. Learn more about our history, and thank you for being a part of our community!
How to chart out the flow of the economy of a game

Author

It depends what you're trying to do really.
Do you just want to diagram the flow of the economy (sources, sinks) similar to the Ultima Online diagram above you probably want a flow chart using whatever your favorite package for that is: Visio, LucidChart, draw.io, etc.
If you want to actually simulate values flowing through the economy, you might set up a spreadsheet using Excel or Google Calc.
Author
Thanks, jb...I'm just looking for a high-level presentation of flows similar to the diagram above. It's been years since I've done this with games in mind, I was just curious if this is still the best way to diagram flows.

A flow chart to document how items flow from one to another? That's crazy talk! ?
If a flow chart doesn't work well for a flow due to complexity, the table form works for the technically inclined. Not as easily visualized, but the data table works perfectly for any state-based processing including turning machines and FSMs.
Author
5 minutes ago, frob said:A flow chart to document how items flow from one to another? That's crazy talk! ?
If a flow chart doesn't work well for a flow due to complexity, the table form works for the technically inclined. Not as easily visualized, but the data table works perfectly for any state-based processing including turning machines and FSMs.
If you were giving a high-level presentation to people who were unfamiliar with the deep complexities of the system, but still needed to communicate how the system worked, would you recommend a flow chart?
Yes. They can be done in creative ways, like the chart with the faucet and drain in the image in the first post, or in highly technical ways where the shape of each box conveys additional meaning, all depending on what fits your audience best. Segments can also be simplified or expanded as appropriate for the audience.
While this is a flow chart:
Spoiler

This is also a flow chart:
Spoiler

As is this:
Spoiler
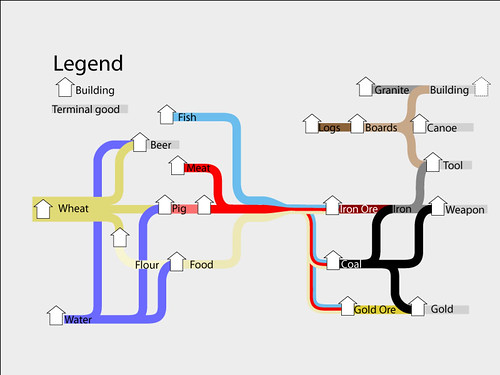
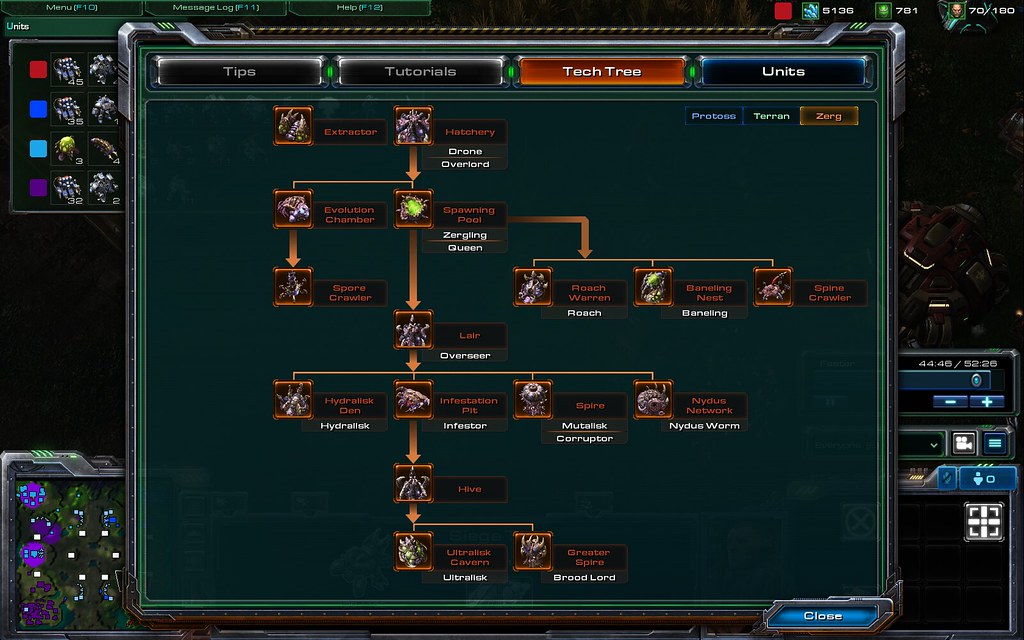
Or even this:
Spoiler

The third one is not a "flow chart", it's a "sankey diagram".
Flowcharts have decisions points which describe decision criteria.
Number 4 is not a flow chart either...

45 minutes ago, Katie said:The third one is not a "flow chart", it's a "sankey diagram".
Sankey diagrams are a type of flow chart.
1 hour ago, swiftcoder said:Sankey diagrams are a type of flow chart.
That's not what your link says. It uses the term flow diagram, which according to Wikipedia is a term can be used either as a synonym for flow chart or as a more general term for the kind of thing a sankey diagram is.
This topic is closed to new replies.
Advertisement
Popular Topics


Advertisement
