Hi!
I'm currently working on a Vulkan Renderer and during performance testing/profiling i noticed that some shader/rendering operations took longer than expected. (I'm cyrrently trying to figure out if this is some form of synchronisation issue or if this is simply a performance characteristic of my GPU.)
Note that i'm testing this on an Nvidia Geforce GTX 1060 (6GB) GPU. (Which to be fair is a fairly old GPU nowadays.)
So to make this short here is an example of an SSAO shader that i'm using:
#version 450
#extension GL_ARB_separate_shader_objects : enable
#include "normalCompression.glsl"

layout(binding = 0) uniform SSAOshaderUniform {
mat4 invViewProj;
mat4 projection;
mat4 normalViewMatrix;
vec4 ssaoKernel[32];
vec2 resolution;
vec2 noiseScale;
int kernelSize;
float radius;
float bias;
} ubo;

layout(binding = 1) uniform sampler2D texSsaoNoise;
layout(binding = 2) uniform sampler2D texViewDepth;
layout(binding = 3) uniform sampler2D texViewNormal;


layout(location = 0) in vec2 fragTexCoord;


layout(location = 0) out vec4 outColor;


vec3 depthToWorld(sampler2D depthMap,vec2 texcoord,mat4 inverseProjView){
 float depth = texture(depthMap,texcoord).r;

       //vec4 position = vec4(texcoord,depth,1.0);
       vec4 position = vec4(texcoord* 2.0 - 1.0,depth,1.0);


       position = ((inverseProjView)*position);
       return vec3(position/ position.w);
}

vec3 reconstructViewPos(vec2 texcoord,float depth,mat4 invProj){

vec4 clipSpaceLocation;
clipSpaceLocation.xy = texcoord * 2.0f - 1.0f;
clipSpaceLocation.z = depth;
clipSpaceLocation.w = 1.0f;

vec4 homogenousLocation = invProj * clipSpaceLocation;
return homogenousLocation.xyz / homogenousLocation.w;
}


//Plane equation. Define a plane pointing towards the +Z axis, use "coords" to select a point on the plane. Returns the z-coordinate at this specific point
float calcDepthOnPlane(vec3 planeNormal,vec2 coords){
return (-planeNormal.x * coords.x - planeNormal.y * coords.y)/planeNormal.z;
}


void main()
{

int kernelSize = ubo.kernelSize;
float radius = ubo.radius;
float bias = ubo.bias;


//position and normal should be in viewspace!
vec2 fragPosCentered = (floor(fragTexCoord * ubo.resolution)+vec2(0.5,0.5))/ubo.resolution;//ivec2(floor(fragTexCoord * resolution));

vec3 fragPos = depthToWorld(texViewDepth,fragPosCentered,inverse(ubo.projection));//ubo.invViewProj);
vec3 normal = (ubo.normalViewMatrix * vec4(normalDecode(texture(texViewNormal, fragPosCentered).rg),1.0)).xyz;
vec3 randomVec = (texture(texSsaoNoise, fragTexCoord * ubo.noiseScale).xyz * 2.0) - 1.0;
randomVec.z = 0.0;


vec3 tangent = normalize(randomVec - normal * dot(randomVec, normal));
   vec3 bitangent = cross(normal, tangent);
   mat3 TBN = mat3(tangent, bitangent, normal);

// iterate over the sample kernel and calculate occlusion factor
   float occlusion = 0.0;
   for(int i = 0; i < kernelSize; ++i)
   {
       // get sample position
       vec3 samplePos = TBN * ubo.ssaoKernel[i].xyz; // from tangent to view-space
       samplePos = fragPos + samplePos * radius; //viewspace pos

       // project sample position (to sample texture) (to get position on screen/texture)
       vec4 offset = vec4(samplePos, 1.0);
       offset = ubo.projection * offset; // from view to clip-space
       offset.xyz /= offset.w; // perspective divide
       offset.xyz = offset.xyz * 0.5 + 0.5; // transform to range 0.0 - 1.0
       // get sample depth
       float sampleDepth = depthToWorld(texViewDepth,offset.xy,inverse(ubo.projection)).z;//depthToWorld(texViewDepth,offset.xy,inverse(ubo.projection)).z;//texture(gPosition, offset.xy).z; // get depth value of kernel sample

       // range check & accumulate
       float rangeCheck = smoothstep(0.0, 1.0, radius / abs(fragPos.z - sampleDepth));
       occlusion += (sampleDepth >= samplePos.z + bias ? 1.0 : 0.0) * rangeCheck;
   }
   occlusion = 1.0 - (occlusion / kernelSize);


vec3 fColor = texture(texViewDepth, fragTexCoord).rgb;

outColor = vec4(occlusion,occlusion,occlusion,1.0);
}
Note that i used a radius of 0.1 to make sure that sampled pixels are as close as possible together. (even with that performance is horrible. Normally i use a larger pixel radius.)
Fairly standard SSAO with one addition where i sample the geometry normal (once) and use this to improve subpixel accuracy.
So the shader taps the Depth buffer once (32 bit floating point format), the normal buffer once (VK_FORMAT_R16G16_SFLOAT encoded normals) and then taps the Depth buffer multiple times depending on how big the kernel is.
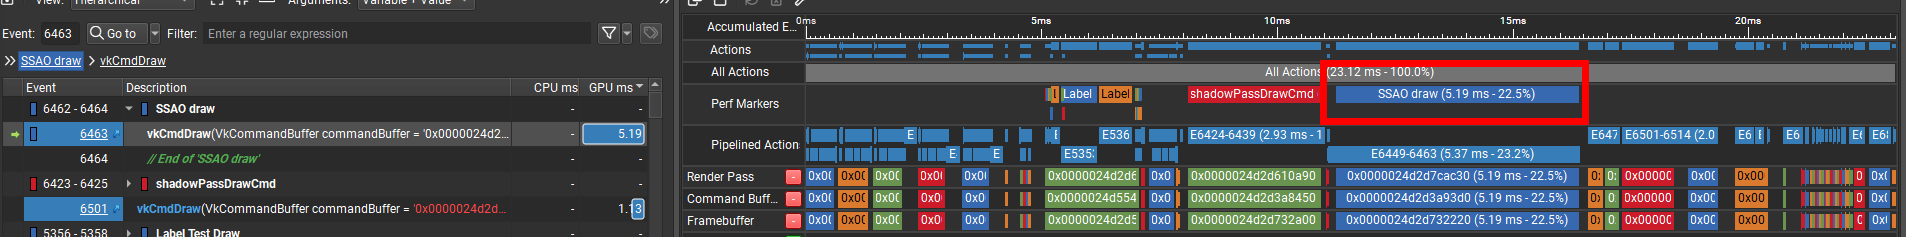
I selected a radius of 0.1 (in view space) and then made two tests, once with 16 samples and once with 32 samples.
This is at FullHD (1080p) resolution.
32 samples:

16 samples:


You can see that the ssao shader takes over 5ms to execute with 32 samples. Over 3 with 16. (Which seems a bit excessive?) This goes up if i use a bigger sampler radius.
Removing the entire for loop reduces the execution time to 0.09 ms.
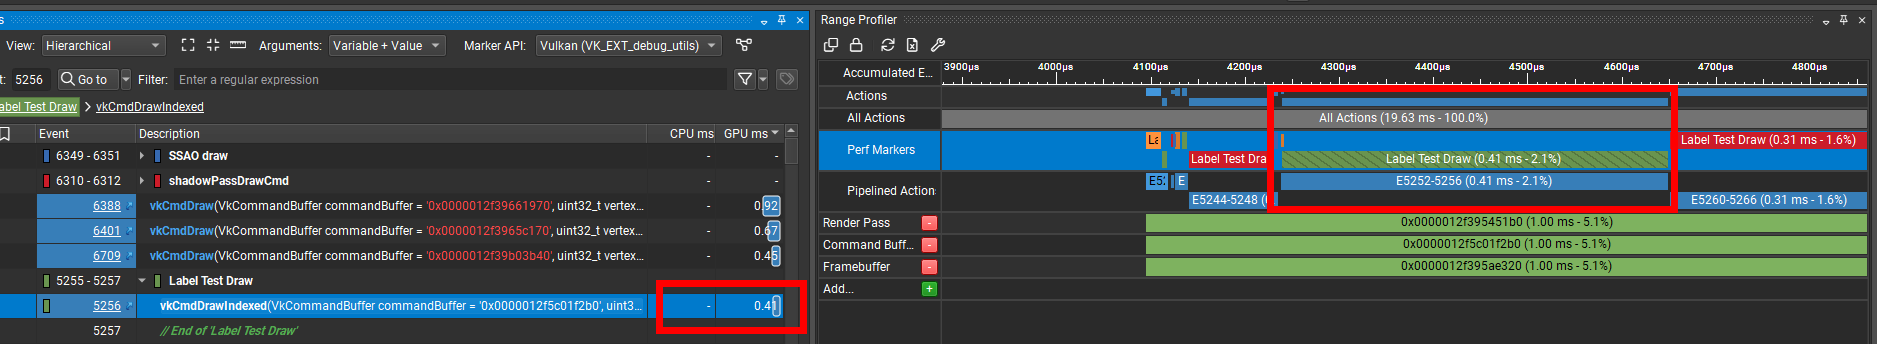
Another thing i noticed is that a "simple" shader which renders data into the gbuffer takes also a while to execute.
Note that the GBuffer is rather large (which i have to optimize). I tested the performance by only writing to 4 attachments at once (all of them 32 bit buffers) as well as a 32 bit depth buffer.
It takes 0.4 ms to render the (rather simple) geometry. (Which might not seem a lot but if you want to cram all your rendering into a timespan of 16.6 ms, then spending 0.4ms on a “basic” mesh is a lot imho. This gets worse the more attachments you add.)
Accessing all attachments in the shader takes 0.8 ms.
This is the shader:
#version 450
#include "normalCompression.glsl"
#include "normalFilter.glsl"
layout(binding = 1) uniform sampler2D sAlbedo;
layout(binding = 2) uniform sampler2D sNormal;
layout(binding = 3) uniform sampler2D sMetal;
layout(binding = 4) uniform sampler2D sRoughness;
layout(binding = 5) uniform sampler2D sEmissive;
layout(binding = 6) uniform sampler2D sAo;
layout(binding = 7) uniform sampler2D sShadow;
layout(location = 0) in vec3 fragColor;
layout(location = 1) in vec2 vTexcoord;
layout(location = 2) in vec3 vNormal;
layout(location = 3) in vec3 vModelViewPosition;
layout(location = 4) in vec2 fragTexCoordLightmap;
layout(location = 5) in float emissionMultiplier;
layout(location = 6) in mat3 tangentToWorldMatrix;
layout (location = 0) out vec4 gAlbedo;//32 bit RGBA8
layout (location = 1) out vec2 gNormal;//32 bit R16G16
layout (location = 2) out vec2 gNomalGeometry;//32 bit R16G16
layout (location = 3) out vec2 gNormalClearcoat;//32 bit R16G16
layout (location = 4) out vec4 gMetallicRoughness;
layout (location = 5) out vec3 gEmissive;
layout (location = 6) out float gShadow;
void main() {
gAlbedo = texture(sAlbedo, vTexcoord) * vec4(fragColor.rgb,1.0);
vec3 normal = filterNormalMap(sNormal, vTexcoord);
gNormal.xy = normalEncode(normal * tangentToWorldMatrix);
gNomalGeometry.xy = normalEncode(normalize(vNormal));
gNormalClearcoat = gNomalGeometry;
//ignore other attachments to test write performance on only 4 of them.
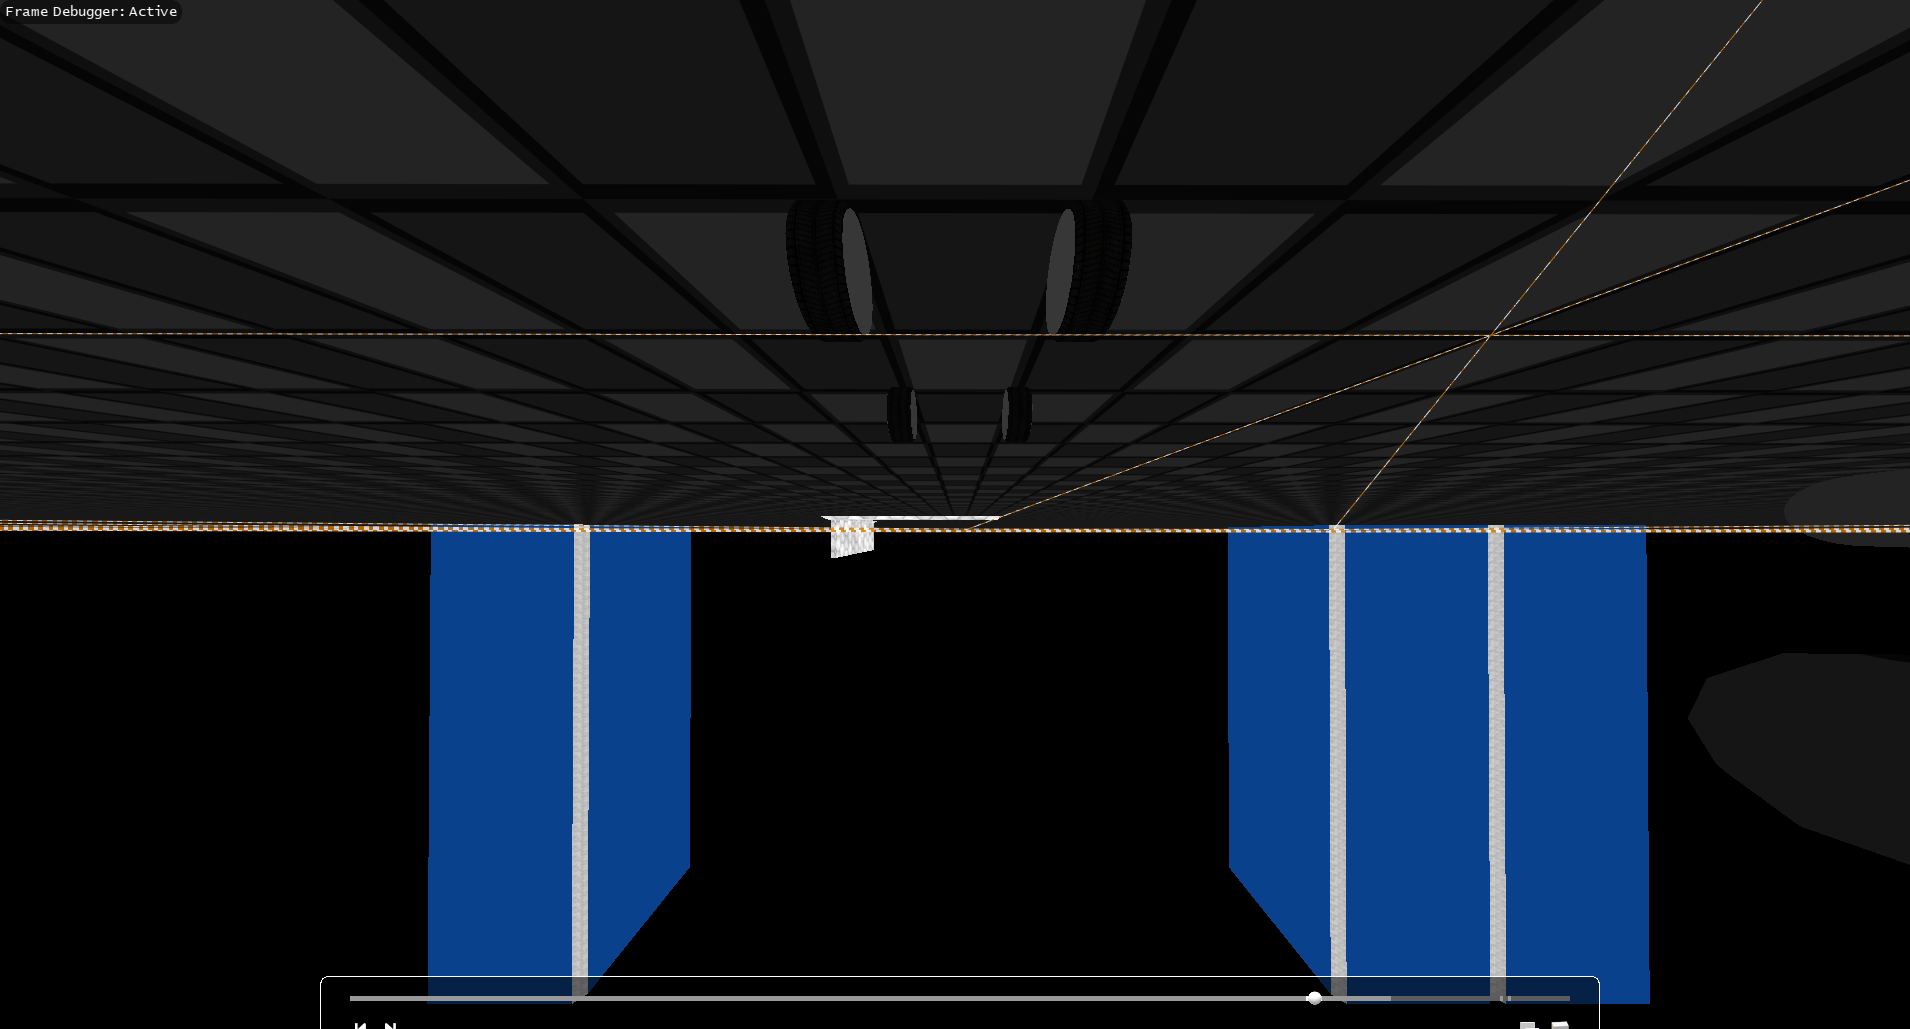
}Pictures: (Note that only the floor/grid hightlighted in wireframe is rendered.)
So has anyone an idea/input as to where i could look for the cause? Is this simply the performance level that i can expect of a GTX 1060 or is this likely caused by aggressive synchronisation on my part?